All Streets
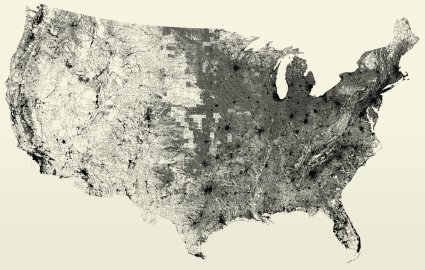
This is lovely: All Streets by Ben Fry, a data visualization of “[a]ll of the streets in the lower 48 United States: an image of 26 million individual road segments. No other features (such as outlines or geographic features) have been added to this image, however they emerge as roads avoid mountains, and sparse areas convey low population. The pace of progress is seen in the midwest where suburban areas are punctuated by square blocks of area that are still farm land.”
Created in 2006; Ben describes how it was done in this blog entry: “Nothing particularly genius about this piece—it’s mostly just a matter of collecting the data and creating the image. But it’s one of those cases where even in a (relatively) raw format, the data itself is quite striking.” No kidding. Also via Kottke.

Comments
blog comments powered by Disqus