U.S. Unemployment and Job Losses
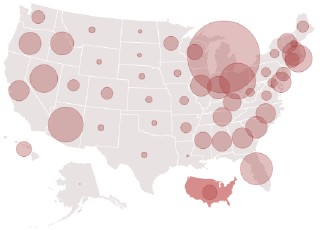 The Center for American Progress has an interactive map showing state-by-state unemployment rates and job losses, with a timeline dating back to 2005. It’s not a pretty picture: “Employers have laid off 4.4 million workers since the recession began, and a record 12.5 million workers are now unemployed. … Michigan continues to have the highest unemployment rate in the nation at 12.0 percent, followed by South Carolina (11.0 percent), Oregon (10.8 percent), North Carolina (10.7 percent), and Rhode Island and California (10.5 percent).” Via The Map Scroll.
Previously: Mapping the Recession and the Stimulus.

Comments
blog comments powered by Disqus