Interactive Map Shows the Impact of Global Warming

Met Office Climate Change Map (screenshot)

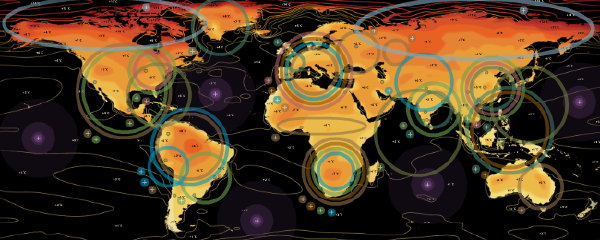
The Guardian reports on the British government’s release of an interactive map that shows the impact of a four-degree rise in average global temperatures. “It shows that the rise will not evenly be spread across the globe, with temperature rises much larger than 4C in high latitudes such as the Arctic. Because the sea warms more slowly, average land temperature will increase by 5.5C, which scientists said would shrink agricultural yields for all major cereal crops on all major regions of production.”

1
Posted on Friday, October 23, 2009 at 8:50 AM
Categories: Environment

Comments

[TypeKey Profile Page] Tamas Balazs:

There are other layers on that map showing various environmental resources such as crops, water availability and so on. The scariest results come from the permafrost layer. According to that layer folks from Mongolia, Alaska and Northern Canada will need to consider moving southwards in the future.

Altogether, I like this apps, yet it does not show much positive forecast for us Europeans. Nevermind…:)

This entry is more than 30 days old and is closed to new comments.

Comments on all entries are available via RSS.