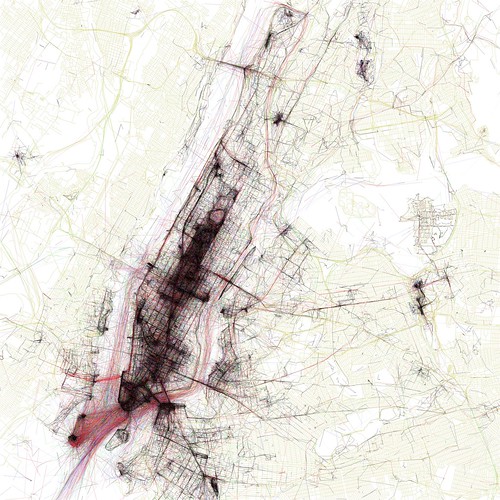
The Geotaggers’ World Atlas
The Geotaggers’ World Atlas is Eric Fischer at work again: this time he’s taken geographical data from Flickr photos, determined the speed at which the photographers were travelling based on their photos’ timestamps and geotags, and plotted them on an OpenStreetMap background layer. He’s done this for 50 cities. The colours are the same as with his map of San Francisco’s Muni: black is less than 7 mph (11 km/h), red is less than 19 mph (30 km/h), blue is less than 43 mph (69 km/h), and green is faster. Via Burrito Justice and Flickr Blog.
Previously: Mapping the Muni.


Comments
blog comments powered by Disqus